About Us
Delivery Model
Business Model
Career
Data Privacy
Contact Us
Precision Data Services for Results that Matter. Start Your Data Journey Today!
About us
Contact us
Region - Wise & Restaurant Listings
Food Menu & Add-On Items
Competitor Price Monitoring
Promotions & Offers
Mobile App Data Scraping
Reviews & Ratings
Real-Time API
Food Aggregators
Softdrinks & Beverages
Wines & Beers
QSR Data
Cloud Kitchens
Management & Counsulting
Invesment Management
Service Providers
Brands
Food Chains
Sales & Marketing
Market Panetration
Future-Proof Your Business with Data Services Tailored to Your Vision
QSR
Food Service Providers
Food Chain Data
Sales and Marketing
Food Market Panetration
Restaurant Data Analytics
Food Delivery Analytics
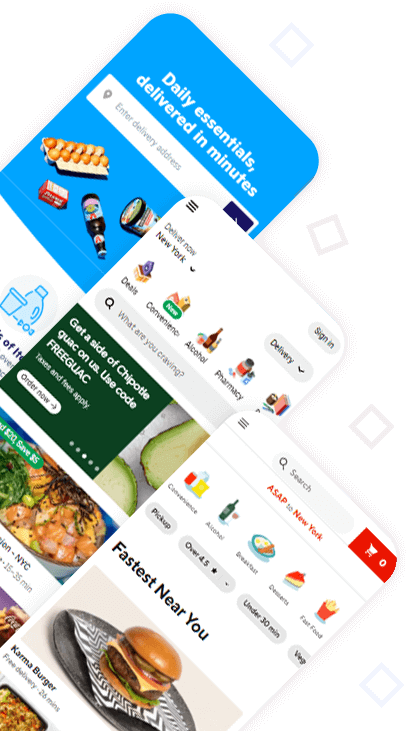
Doordash
Swiggy
Deliveroo
Wolt
Ubereats
Glovo
Zomato
Foodpanda
Justeat
Grubhub
Experience Accurate Data Scraping Services At Budget-Friendly Price
Zomato API
Grubhub API
Ubereats API
Postmates API
Doordash API
Seamless API
JustEat Takaway
Deliveroo API
IFood API
Gopuff API
Swiggy API
View All
Wolt API
Glovo API
Foodpanda API
Justeat API
Instacart API
Safeway API
BigBasket API
Ocado API
Costco API
Amazon API
Kroger API
InstashopAPI
Walmart
Big-Basket API
Instashop API
Walmart API
Case Studies
Blogs
Whitepaper
FAQs
We'de love to hear what you are working on. Drop us a note here and we'll get back to you within 24 hours.
Select Required ServiceFood Data ScrapingFood Data APIFood App ScrapingData AnalyticsCustom DataOther Services
Submit